
This fan’s expectations going into last Sunday’s Pennzoil 400 was not very high. It was for good reason.
For the last little bit, what fans had seen on the “cookie cutter” mile and a half quad-oval tracks was far from ideal racing. So much so that the entire sport appears to be shifting as a result. What fans have observed at races on these tracks of late is that –
• These car can’t race. We need a new car but they won’t be here until 2022.
• The aero/horsepower package still stinks. That new car needs to fix that.
• Cookie cutter races are boring. Dump the mile and a half’ers and get more short tracks and road courses on the schedule. Bye bye Chicagoland, Kentucky. When we see you again, Fontana, you’ll be a short track. Texas, you like Charlotte, will give up one of your cookie cutter points dates to a road course. Vegas and KC… you’d better watch out.
So after last year’s race, why would expectations be high?
Same old “unraceable” car, using the same old aero/HP package and the same old tires on the same old “unraceable” track that last year produced a grand total of TWO, count them TWO, green flag racing passes for the lead. TWO.
Two hundred and sixty some laps of racing and TWO passes for the lead.
By NASCAR’s count, there were 20 lead changes for that race. But if you throw out the passes on starts, restarts and “strategy passes” for green flag pit stops there were only six lead changes with four of those were on pit road under caution.
When you have more competition lead changes on pit road (3) than you have passes for the lead on the track under green (2) that’s saying something and what it’s saying isn’t good.
And that was a Playoff race for goodness sakes!
But something changed.
Like a NASCAR variation on the old joke that “I went to a fight and a hockey game broke out” I, along with 4.358 million of my closest racing friends (don’t worry, we were all social distancing) tuned in Sunday. Some expected another high speed Cup parade only to find that a race broke out.
Something changed.
Not sure what it was… but I liked it
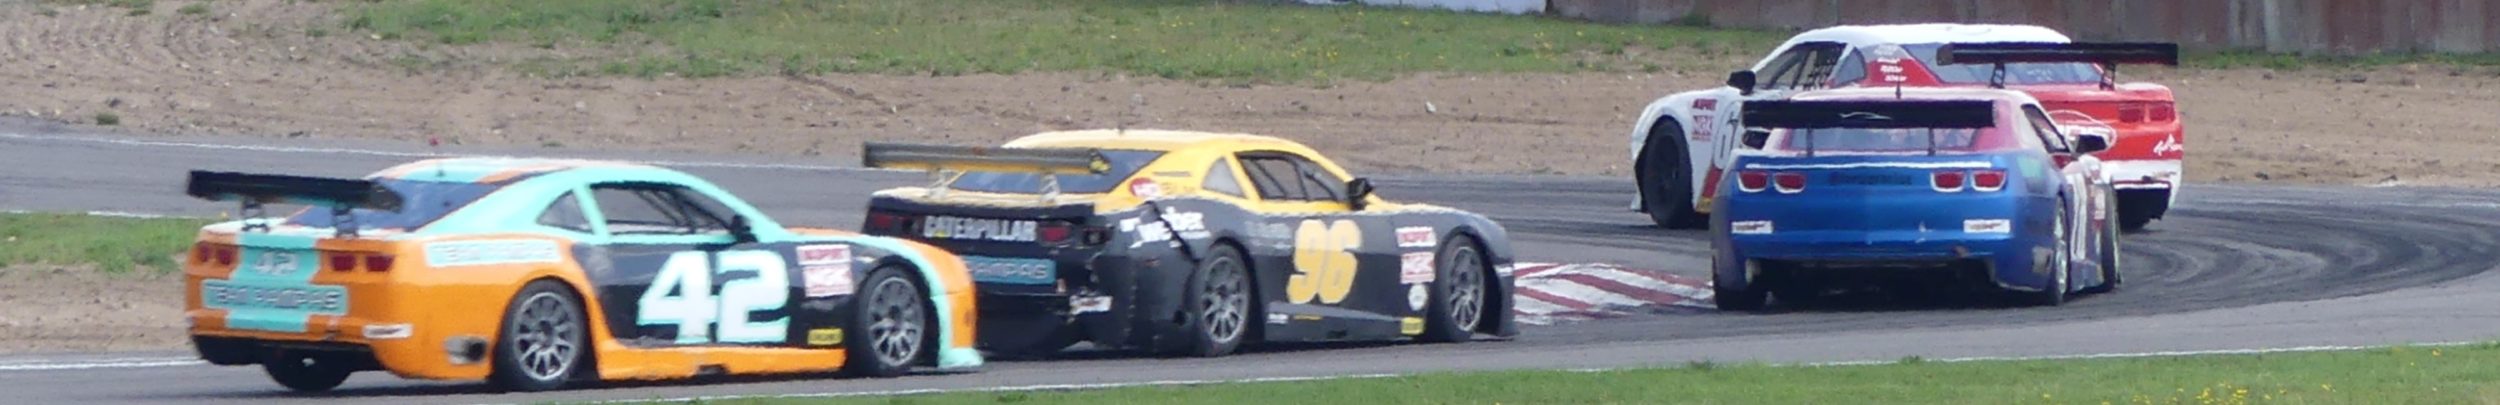
Las Vegas was different and fun to watch. Four races into his refurbished career, Kyle Larson wasted little time taking his new ride into Victory Lane. His seventh career win put him in the 2021 Playoff Hunt along with Michael McDowell, Christopher Bell and William Byron.
Show of hands and be honest here – how many had this group in the Playoffs, much less being the first four in?
Wonder what the Vegas odds on that was?
Larson not only won the race but did so in surprising fashion. He led 103 of the 267 laps which more than doubled Denny Hamlin’s 47 lap effort. On the surface that sounds boring until you realize it took Larson six lead changes to accomplish that – five green flag lead changes and a single caution flag lead change
His leads were 4, 9, 17, 15, 20 and finally 30 laps. So there was no dominating run (although that final one was the longest anyone held all day). He led in all three Stages-winning Stage Two and the race and found the front in a variety of ways, most of them the old fashioned way – he passed the leader without benefit of a restart or “strategy”. Four on his six lead changes were racing passes, where he drove by the leader. Four racing passes.
That’s double what the entire field did in last fall’s Playoff race here.
Think about that for a minute.
In addition, the #5 won the race off pit road once and only had one “strategy” pass where he reassumed the lead as a result of green flag pit stop cycles. Overall, Larson performance was something we had not seen in Cup event in a while. An event that looked like a race.
Something changed.
Or did it? Is what we saw on our screens Sunday real or just another David Copperfield illusion?
No, it wasn’t just Larson, your eyes weren’t playing tricks on you and it wasn’t an entertaining sleight of hand. This race’s numbers reflect the differences in so many other ways.
Vegas’ 27 lead changes was the highest of the season.
Lead Changes:
Las Vegas – 27
Daytona 500 – 22
Homestead – 20
Daytona RC – 12
Coupled with that, its 24 Green Flag Lead Changes was also a season high and doubled the number from last week’s race at another 1.5 mile track, Homestead
Green Flag Lead Changes:
Las Vegas – 24
Daytona 500 – 18
Homestead – 12
Daytona RC – 7
Since the laps for a race have varied from a low of 70 at the Daytona Road Course to 267 at Homestead and Las Vegas, let’s look at the Green Flag Passes for position at the scoring loops and see where Vegas ranks
Green Flag Passes
Las Vegas – 4057
Homestead – 3411
Daytona RC – 2877
Daytona 500 – 2755
A closer look shows that although Vegas didn’t set a new season high for Quality Passes (P1-P15)
Quality Passes:
Daytona 500 – 1819
Las Vegas – 1666
Homestead – 1146
Daytona RC – 715
There was nearly one-third more racing up front than Homestead, which is the other 1.5 mile track.
Another interesting note was the distribution of the passes. Since NASCAR measures the Quality Passes as P1-P15, those 15 positions make up just over 39% of the field. A percentage of Quality Passes higher than that would indicate that most of the passing took place up front. A QP percentage lower than 39% would mean that the action took place in the back of the field. Let’s see how the first four races stack up –
% Quality Passes:
Daytona 500 – 66.03%
Las Vegas – 41.06%
Homestead – 33.06%
Daytona RC – 24.85%
This means that at the Daytona 500, the bulk of the action was up front in P1-P15, while at Homestead and Daytona RC the action was at P16 or lower. Las Vegas’ 41.06% nearly matched the “ideal” indicating that the action was distributed throughout the field with just a smidge more in the front
When you take a closer look at the Quality Pass Loop Data you see the following breakdown of those QPs for the lead. This means that somewhere on the track there was a position change at the front of the field. Surprisingly, these unraceable cars, using this unworkable package on this boring track produced the most Green Flag Quality Passes for the Lead for the season.
Green Flag Quality Passes for Lead:
Las Vegas – 56
Daytona 500 – 45
Homestead – 34
Daytona RC – 9
We have already discussed the Green Flag Lead Changes above but, when you compare the Green Flag Passes for the Lead (Lead Change at any scoring loop) vs Green Flag Lead Changes you get an idea of just how “racey” the cars were. The higher the percentage means that once the position changed at a loop, the higher the chances were that they held the position back to the Start/Finish Line for a Lead Change. The lower this percentage is, the “racier” the cars were up front.
Looking at these two numbers we get this interesting metric
Green Flag Passes for Lead vs Green Flag Lead Changes:
Homestead – 35.26%
Daytona – 42.22%
Las Vegas – 42.86%
Daytona RC – 77%
So at the Daytona RC, once someone got to the lead anywhere on the track, chances were high they were not going to be passed before they got back to the Start/Finish Line. So, Las Vegas wasn’t the “raciest” race to date – that distinction belongs to Homestead, the other 1.5 mile track, but it was almost as “racy” as the Daytona 500. With its more overall action up front it still proved to be an entertaining race.
My yardstick, my favorite unit of measurement is the Green Flag Pass On Track for the lead – the racing lead change. Those are the old-fashioned “I had the lead and you passed me” for the lead. These are not the ones that result in the field being packed up after the start or restart. And it doesn’t include those green flag lead changes that are a result in “strategy” calls on green flag pit cycles. Taking over the lead because the leader pitted before you won’t be in these numbers. These are just old-fashioned racing passes for the lead. This is racing. So how much racing was there?
Green Flag Racing Lead Changes:
Las Vegas – 11
Homestead – 5
Daytona 500 – 4
Daytona RC – 2
To put this in perspective, if you watched the Pennzoil 400 Sunday and if FOX was on their game and showed all the racing passes for the lead, you saw the same number of racing passes for the lead as you had seen in the previous three races combined.
Maybe that’s what I like about this race – folks were racing.
A perfect race? Hardly.
Some measure the “goodness” of a race by the margin of victory. Larson’s margin was by far the largest of the three races that have finished under green and nearly a second more than the “closest” green flag finish this season at the Daytona RC.
Margin of Victory:
Daytona RC – 2.119
Homestead – 2.777
Las Vegas – 3.156 seconds
You’ll often hear some of the Talking Heads use “Cars on the lead lap at the finish” as a measure of the competiveness of a race. The more cars that finish on the lead lap, the more chances to win and the more Excitement and Drama that race produces. That may be the case.
Unfortunately, Las Vegas had a long green flag run at the finish. Without that caution flag to bunch the field, give Lucky Dogs and Wave Arounds to those down a lap it reduced the number of cars on the lead lap to a season low of 14 cars. This was a low when compared to the other races, including Daytona 500 with all of its crashes that took out so many cars.
Cars on Lead Lap at Finish:
Daytona RC – 32 of 40
Homestead – 25 of 38
Daytona – 16
Las Vegas – 14
Overall, the bulk of the action was in Stage 1. It was in that opening round where 11 of the 24 green flag lead changes took place and 7 of the 11 Racing Lead Changes occurred. The second Stage had a lead change on a restart and one Racing Lead Change, with the remaining five “strategy” passes due to the green flag pit cycles. The final stage although the longest had the fewest green flag lead changes with two taking place on restarts, one due to “strategy” and the remaining three were Racing Lead Changes.
So as we’ve seen in other races, Stages 1 and 2 has more action up front and the final stage kind of “flattens” out as they come to the finish. Last week, the reason was attributed to a drop in the ambient temperature affecting the “stickiness” of the tires. Never heard what the reason was for the Stage 3 “flatness” here. Maybe it was just a hungry driver in good equipment trying to get back into Victory Lane to prove himself.
But even with that “flatness” the “strategy” move by Daniel Suarez to long pit and stay on the track while others pitted put him out front on lap 226. Suarez played the card that had helped Kurt Busch win the race here last year-staying out and hoping for a caution. For twelve laps he led the field, surely hoping that Kyle Busch would get another flat tire and go for a lazy spin to bring out a caution… but that gamble didn’t pay off this year like it did for Kurt last year.
But for 12 laps, you had to wonder are we going to have another first time winner?
The “strategy” drama was compelling enough to keep interest in the finish, as Larson made the final Racing Pass for the lead on lap 238 and held off the field for the final 30 laps for the win.
No, the numbers reflect the race we all saw on Sunday. That unraceable cars, running bad aero/HP packages, on tires that produced two racing passes for the lead the last time used on this boring cookie track put on a heck of a race. Though far from scientific, 88.5% of the tweeters to Jeff Gluck’s Good Race Survey liked it.
It was almost like those 38 drivers got together and decided to forget the stages, drop the “strategies”, turned off their headsets to the “War Rooms” and go race. Maybe it was a lot of potential sponsors in town they wanted to impress. Could it have been they all had significant side bets riding on their performance?
One difference is one was a Regular Season race and the other a Playoff race. Maybe that caused a change in the Risk vs Rewards creating different dynamics. Thirty-eight drivers racing for the win to make the playoffs has to look different than twelve looking to advance to the Round of Eight, while 27 are trying to make sure they are “not the guy” that messes up one of the contenders’ Playoff chances.
I don’t know what happened but I do know…
Something changed.
Maybe if it had happened sooner we wouldn’t be looking at so many other changes.
Tune in for Phoenix and let’s see if the change is real… or just another David Copperfield illusion.
Till then… Thunder on and Stay Safe
Photo Credit; Brian Lawdermilk/Getty Images
That’s an amazing article David. Interesting, analytical and even educational in some way. You dissect the races and put on your “Sherlock Holmes” view in a remarkable way. I love it. Keep it coming!
Thanks Jens! Glad you enjoyed it. Phoenix should be interesting if for no other reason than the restarts. Tune in next week and we’ll see what the untold numbers tell. Thanks again for your comments. Much appreciated!
David, I love it! I really like the excitement in your article and the stats! Looking forward to your next one. Sure hope Phoenix gives the same excitement.
Thanks Vivian! You and me both! Stay safe. Hoping for a good race this weekend.
All very interesting, but the end of the race was “same-old, same-old” with no chance of a pass for the win. Stage 1 and 2 were good, but it seems NASCAR is completely unable to provide an exciting (or even interesting) finish without a late-race caution. I guess it’s time for the field fillers to get back their instructions to wreck with 10-15 laps to go, like the good old days. Or declare a final stage of 20 laps. Unlike the NBA where only the last few minutes matter, in NASCAR we can safely change the station with 50 laps to go.
Jo, thanks for your comments. Totally agree that the third stage continues to be a struggle. Remember how racy New Hampshire was last season in Stages 1 and 2? Hamlin and Keselowski put on a heck of a race and then Stage 3 appeared and the #2 ran off and hid the last 83 laps. When the best race NBC could show in Stage 3 coming to the finish was a three car “battle” for tenth, something is wrong. Unfortunately, for whatever reason, that’s not improved much. Larson led the final 30. Byron was worse. At least at LV we saw a pretty racy S1 & 2 which is a marked improvement. Is racing corrected? Have they gotten the perfect product-not hardly. But I think this shows that racing is possible with this car, on this track with this package and tires and that’s better than what we’ve seen in a while… a long while. Hope they get Stage 3 figured out. Thanks again for reading and your comments. Stay safe!