


Sunday’s NOCO 400 from Martinsville was the fourth short track race this season using a new aero package to improve the on-track product.
How did it work?
Statistically, the NASCAR Loop Data in many areas looked like it was a step in the right direction.
Green Flag Passes increased significantly from the 2022 race as the Loop Date registered 2026 GFP and a Green Flag Passing Rate of 5.8 Green Flag Passes per Green Flag Lap. This compared to 2022’s 1233 GFPs and a passing rate of 3.4. So not only did it surpass last years race but statistically trounced the 2022 Fall Race that in 500 laps could only muster 674 Green Flag Passes and an anemic 1.5 Green Flag Passes per Green Flag Lap.
Comparing passing rates, you have to go back to the 2015 STP 500 to find a race with a greater GF Passing Rate. That race had a whopping 6.9 GF Passes per GF Lap compared to Sunday’s 5.8.
Additionally, Lead Changes doubled from 2022, going from 5 to 10.
Superficially statistically, pretty impressive.
But when you dig a little deeper, peel another layer off the Martinsville onion you find that of those 2025 Green Flag Passes registered, 1392 or 68.2% were for Position 16 on back. This means the bulk of passing took place mid-pack or lower. Due to broadcast limitations these are outside what is shown to fans at home, so fans at home don’t get the at-track “action”.
Lead Changes
Doubling the Lead Changes on the surface sounds impressive until you look at when they occurred. 5 occurred under Caution-once when leader Ryan Preece got penalized for speeding, Chase Briscoe won the race off pit road and the rest where the Leader pitted and gave up the lead to a car that didn’t pit.
Strategy Passes.
That leaves 5 Green Flag Lead Changes.
The Race Start and 5 Restarts produced no Lead Changes.
2 Green Flag Lead Changes were a result of the Leader Pitting Under Green, giving the lead up to someone else.
Three Green Flag Lead Changes were actually Racing Lead Changes-where one car passed another for the Lead.
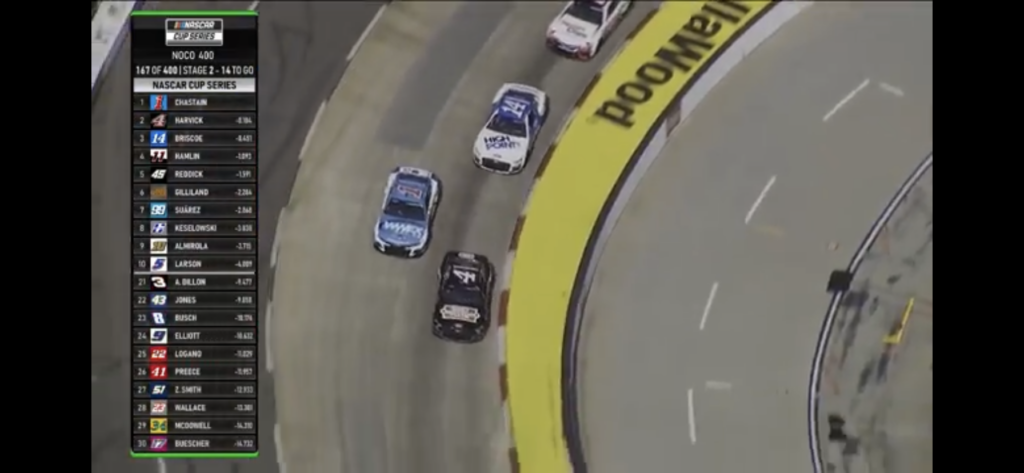
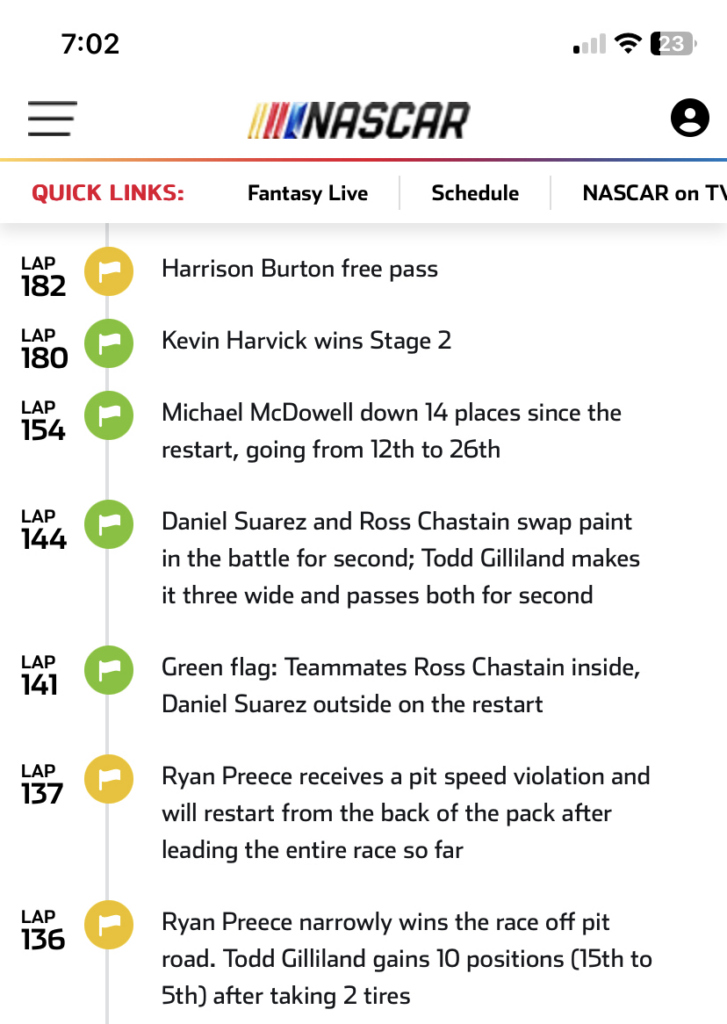
The first was on Lap 167, Kevin Harvick fresher tire advantage passed Ross Chastain who was on older tires. On this pass, FOX did their dead level best to try and miss it by cutting away to another exchange as Harvick made his move. The booth was talking about the battle up front when the picture suddenly went to the other exchange. They did finally manage to switch back and catch the pass, which is more than can be said for NASCAR on their Timeline. Even though this pass led to Harvick getting his first Stage win of the season, it didn’t even make the NASCAR Timeline.
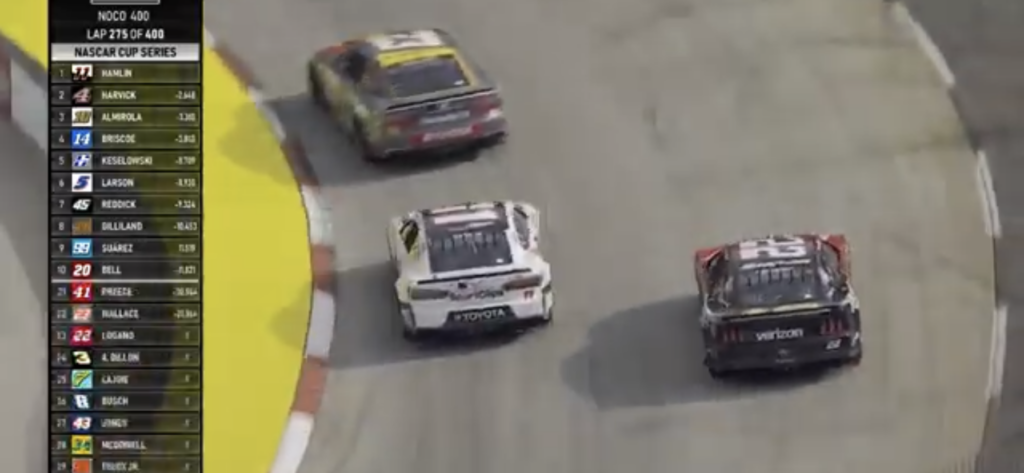
On Lap 257, Denny Hamlin passed Chase Briscoe to move to the point. This was the only Racing Lead Change that involved two cars with no tire differential as both had taken four tires at the last pit stop.
The only strategy involved here was outrun the other driver, which is what most fans think is going on when they hear “Lead Changes”. As we’re seeing, that is not the case.
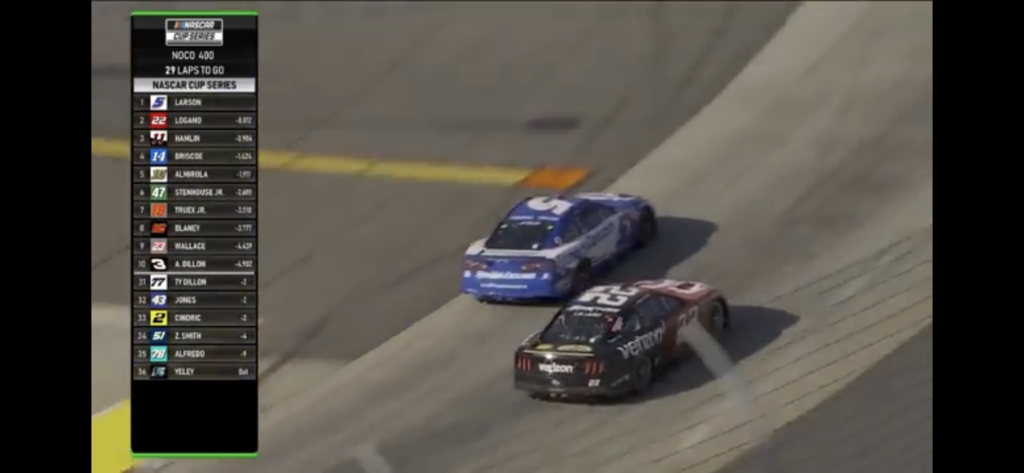
And finally, the winning pass on Lap 371 where Kyle Larson, who took on two tires passed Joey Logano who stayed out and took no tires. Larson was able to lead the final 30 laps, holding off late race charges by cars that took four tires to finish with a 4.142 second Margin of Victory.
So when you distill it down there was only one true Racing Lead Change for 322 Green Flag Racing Laps. Everything else was tire strategy.
Not the look you expect for 400 Laps on a 1/2 Mile Bull Ring, especially with cars tricked out with a new aero package, new tires and much favorable weather.
So how about the eyeball test?
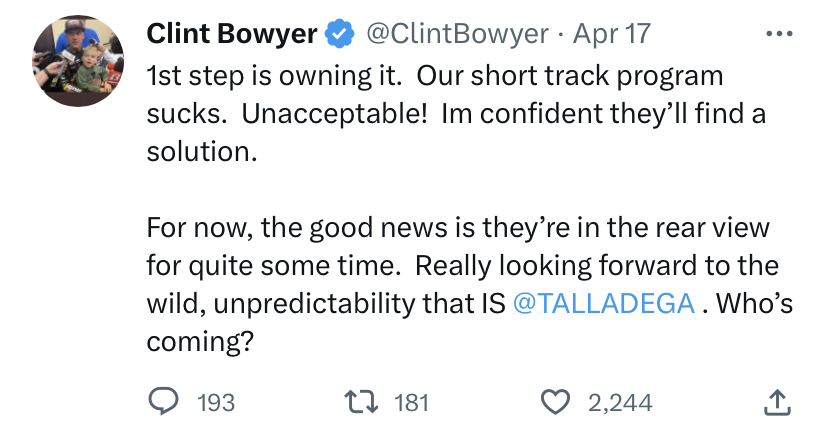
Since the checkered flag fell, the drivers complained about the NEXT GEN lacking the ability to pass. Fans found the NOCO 400 to not be a good race. Even broadcasters like FOX’s Clint Bowyer said the NEXT GEN short track package sucks. Everyone seemed to be dissatisfied and everyone had an opinion and/or solution to make the racing better that included ditching the car and starting over to adding horsepower, reducing brakes, changing gears to end shifting, to changing tire compounds for more fall off to reducing tire widths and more.
So how can the stats say one thing and the “eyeball” test say something different? Do numbers tell everything?
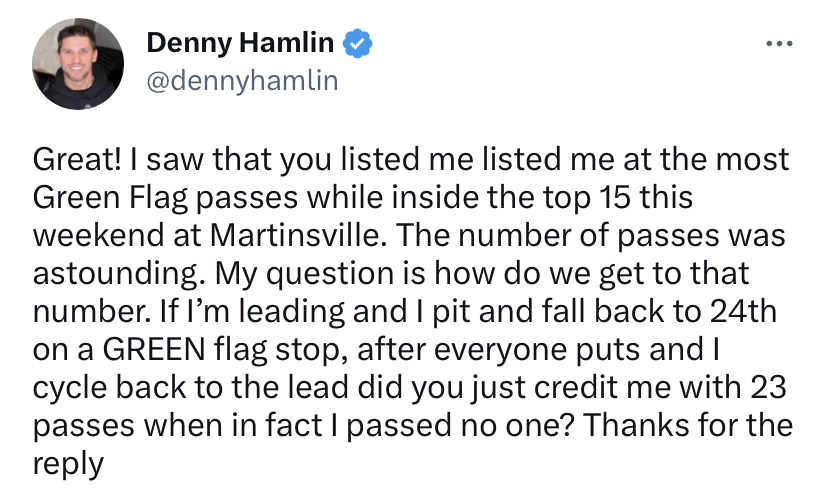
Enter the driver of the #11, Denny Hamlin who calls into question the numbers and what they actually mean to NASCAR’s stat man Mike Forde.
The answer is Yes. If Denny pits from the lead, comes out 24th and after everyone else pits and he finds himself back in the lead at the end of the pit cycle, he gets credit for 23 passes even though he passed no cars on the track.
Weird isn’t it? But that’s the way Loop Data is counted.
It is what it is.
But it gets better.
Each of these 23 other cars who passed Denny while he was in the pits… they each get credited for passing him even though he wasn’t on the track.
The result in this instance is now 46 Green Flag Passes for Denny pitting under green although no fan saw him pass a car on track or a car pass him on track.
What?
Now multiply that by the number of cars and the number of Green Flag pit stops and you have some impressive numbers…
and nobody passed anybody on track.
So on some tracks, especially short tracks where Green Flag Pit Stops can cost a driver so many positions, the mere act of pitting under Green can inflate the Green Flag Pass numbers with no real action taking place on the track. And like the gift that keeps on giving, the more you do, the better the numbers can look.
Just look at the Richmond numbers. Three Green Flag Passes records in a row, but have those been barn burner races?
Check out the Green Flag Pit Stops.
Now do you see how “good” numbers may not mean “good” racing or how “not good” racing can produce “good” numbers?
It Affects Quality Passes…
This even extends into other numbers as well, such as Quality Passes. Quality Passes are Green Flag Passes that take place in the Top 15 positions.
So going back to Denny’s example of pitting first from P1 and coming out P24 to cycle back to the lead, when the other cars in the P1-P15 pitted and he passed them, those passes would count as Quality Passes even though he again made no on track passes.
And Green Flag Passes For the Lead as well
Similarly, for the Green Flag Passes for the Lead and Lead Changes. When the Leader pitted and Denny hit the next scoring loop as the Leader, that counts as a GFPFL. If he holds P1 to the Start/Finish line where Lead Changes are officially scored, it also counts GF Lead Change
So for those numbers, passes that take place as a result of Green Flag Pit Stops can also give one impression as to what really happened when unless you dig deeper may be something entirely different.
And that 2015 Martinsville STP 500…
To further demonstrate this, let’s take a look at the last race that produced similar Green Flag Passing Rates to Sunday’s race. Sunday’s race had 5.8 Green Flag Passes Per Green Flag Lap. The 2015 race had 6.9. Similar numbers should reflect similar races, right?
Hardly.
Sunday’s race had 5 cautions, two for Stage Breaks. 2015 had 16. This meant the pit stops and resultant shuffling took place during cautions and didn’t inflate the Green Flag numbers. GFPs were passes on track rather than shuffling through pit stop cycles where no one passes anyone.
Big difference.
Sunday’s race had 10 Lead Changes among 7 drivers vs 31 Lead Changes between 14 drivers
Big difference
Winning Run Length was 46 Laps vs 34 producing Margins of Victories of 4.142 and 0.183 respectively.
Big difference
If you look back at the cause of the Cautions for each race, Sunday we saw one spin, one single car wreck and one wayward tire.
2015 had 6 single car spins, 1 multi-car spin, 3 single car accidents, 3 multi-car accidents (involving 18 cars), along with 3 for debris.
Looking at those numbers which car do you say is more difficult to drive-the high HP, low aero, narrow tired, small braked, no shifting GEN 6 or NEXT GEN?
If driving difficulty creates better short track racing… aww I’m not even going to ask that question.
Final thoughts
I’m a numbers nerd. Most people aren’t and that’s OK.
Over the last few years I’ve tried to report Loop Data Numbers in such a way as to give fans a different, a broader look at what they are being presented about the race they just saw.
There is more information out there than just the Green Flag Passes and Green Flag Passes For the Lead-the primary metrics NASCAR uses to measure their product. When this additional information is presented, hopefully properly, in proper context and within the limitation each measure has, I feel it gives the fan a more full, a more accurate understanding of each race. It helps explain why things are the way they are. It also triggers questions like those that have been asked by Denny Hamlin and others.
That, along with the growing interest in the Data, it’s presentation and use is to me, encouraging.
To finally ask questions may be the most important thing to come out of the Martinsville weekend.
We’ll see.
On to Talladega!
Thunder on… and Stay Safe
David
Photo Credit (cover): Jared C. Tilton / Getty Images
David, you bogle my mind with all these stats. There is no way I could ever be that kind of stats viewer or research person. Thank you!!!
When you wrote:
Superficially statistically, pretty impressive.
But when you dig a little deeper, peel another layer off the Martinsville onion you find that of those 2025 Green Flag Passes registered, 1392 or 68.2% were for Position 16 on back. This means the bulk of passing took place mid-pack or lower. Due to broadcast limitations these are outside what is shown to fans at home, so fans at home don’t get the at-track “action”.
That really blew my mind. Thanks for that also.
Now, I have to say, just as you do: Thunder on….and stay safe!
Thanks Vivian for your kind words.
I know numbers aren’t for everyone but hopefully it wasn’t tooooo boring.
There is always more to the story than we’re given. Hope this helps.
Thanks for bearing with me!
Take care and have a great race weekend!
If it doesn’t pass the eye or smell test, you can bet that it wasn’t a good race, no matter what the stats say. As I have a masters degree in marketing, statistics was a required course. If one used the right stats, an elephant really can hang off a cliff by their trunk, while holding onto a twig. The problem is, people with only 1 functional braincell know it ain’t so. There in lies the problem. You will notice NASCAR only used stats that favor them.
I have always had respect for Elton Sawyer, until he made a comment about the poor quality of the race. Stating the NASCAR would “Need a longer runway” to decide if a higher HP solution to fix the short track program would work. Stating that the parts that would be needed to make those higher HP engines last, would need to be sorted out. Did he say that with a straight face?? I’m pretty sure that the Big 3 engine programs already know how to make more HP, and that those parts are probably already sitting on the shelf. If not, I’m certain that the aftermarket could readily fix that. Cup teams never had big reliability issues back when 700-800 hp engines were the norm. I haven’t raced in 19 years now. My modified made 650hp then. I was not a rich racer, and I didn’t have really expensive parts in my lone engine. That engine would get freshened up in the off season, then had to last a 22-24 race season, and 2 open practice weekends. And Elton is trying to say that a Cup engine builder, can’t make an engine last an entire race, with a 50-100 hp increase in power? Yeah, I’m not buying that. And since most of the smaller teams get their engines from the Big 3, they shouldn’t be at an HP deficit either. So I’m lost for his explanation for addressing the short track competition issues. Do I think that the new car is the problem? I do, but I would think that with all of the great minds that work in the Cup garage, somebody should be able to find a fix. So it comes back to NASCAR. Do they want a solution that they didn’t put forward? Remember, they along with the manufacturers, drove to have this new car. When you have 3 completely different bodies, how does NASCAR not give an advantage to 1 make or another? That is where the stumbling block is.
One thing that I feel that has been fixed with the new car, are the intermediate track races. David, I can’t quote stats for them, but they seem to be more competitive (eye & smell), than before with the Gen 6 car. As for the super speedways, that’s a crap shoot anyway, so how do you really judge that. One thing is for certain though. The new car takes a hit a lot better than the old one, and still continue for the most part. I’d love to see them do away with the repair clock. A lot of the things that are breaking, is replaceable fairly easily. Without a doubt, these new bodies are much better.
Ron,
Thanks for your extensive comments. You make a ton of great points.
Agree that the eyeball or smell test overriding what the stats say, unfortunately, they are used week after week to try to convince fans that what they saw and their assessment wasn’t really the way it was and their assessment is wrong. The elephant we saw tumble off the cliff… our stats say otherwise so did you really see what you thought you saw.
That’s frustrating. No maddening.
Then when someone asks questions, like Denny did the response is this is what the numbers are and are not a determination of good or bad.
Really?
After listening to hour after hour, day and day, week after week of SIRIUS XM they have about convinced me that after 55+ years of following and watching racing I’m just too dumb to know what I’ve seen.
I think what they say is important but maybe what they don’t say is even moreso. If Quality Passes were favorable wouldn’t they be more impressive than Green Flag Passes? Yet you never hear them mentioned. If Lead Change numbers were so good wouldn’t they be touting those, more easily understood numbers instead of the more cryptic GFPFL?
The fact they aren’t mentioned says something. What? Why?
They will tell you great numbers but nothing for comparison. Do we know if this year was 1000 greater than the next best year or 1? Differential means something.
They were quick to attribute the numbers to NEXT GEN while totally ignoring the changes to the schedule like making Atlanta into a superspeedway. That produced a massive jump in numbers that NG got credit for. Ai contend G6 could have produced numbers close to or greater than NG but NG got the credit.
Is that right?
Don’t you find it interesting that everyone is having a meltdown after a race that had better numbers than the race last year that no one said a discouraging word about? Where was the outcry thrn?
HP… don’t get me started. Betcha that engine that they are taking in the HMS Garage 56 car to Le Mans for a 24 hour race will have greater HP than what is used on Sunday. So it can’t be done?
Said it with a straight face. Sure he did. Did the Bagman and Pistol Pete call him out on it? I didn’t think so…
Longer runway buys time. Keep in mind also teams are paying for these changes and every change drives up the team costs which kinda undercuts the whole purpose for the car. Not a good look.
Racing-short track sucks so far, intermediates better, road races – after restarts no lead changes. Maybe back in the pack but not up front. Last time I checked crowds rarely stand for a spirited exchange for P7. Superspeedways-see if a third lane can form and watch the runs. Remember Stage 1 & 2 at Atlanta was high speed parades with only racing the last couple of laps.
Durability-glad cutting down tires has reduced. Wonder how composite bodies would have worked on GEN6? Still hold breath when back into wall. Heat and fumes are issues to watch for. Six were treated after the race Sunday.
DVP – agree the clock should be dropped. Have theories on that but with points being so valuable shouldn’t teams have a chance to get them. Next to a winless champ my dream is a DVP champ where all four ball it up in the last race and the clock decides who is the season champ.
Whew! Man you put a lot out there. Always enjoy.
Thanks for commenting and have a great race weekend.
I just read a piece on the Cup engines. They spoke with Doug Yates, and he said that if NASCAR wanted to increase hp to the 750 range, that could be easily accomplished. If they wanted to go to the 900hp range, as was the case a few years ago, they would need some time to get parts in-house. Sounds like adding 100 more HP to short track engines wouldn’t be an issue. Now, is that enough to make the tires become the limiting factor, I don’t know. That’s a pretty wide tire that they run now. I think that if they added the 100hp, and Goodyear brought a tire that had a bit more fall off, you might see real passing again. I betting that Goodyear starts getting nervous, when they try and manufacture a tire with a lot of fall off. Because they don’t ever want to have another race like they had at Indy a few years ago. But somewhere in there is a way to get real racing back at the short tracks. With all the troubles they’ve had at intermediate tracks, who would have ever guessed they would be having so much trouble on tracks where aero dependency isn’t an issue?? Go figure.
Haven’t looked at that piece yet. More HP may be the answer. if you recall the drivers had to raise Cain to get it up to where it is now. This is not the direction the Sanctioning Body wants to go in… so longer runway comments are not a surprise. I think one of the Chevy engine folks said if they decided today it would be six month before they could get the parts to start producing those. Not sure so but they but if the case doesn’t that point to a problem created by the sole source provider model?
And how much increase HP can we take before it impacts the cockpit heat issues? Will that then require larger mail slot vents in the front and additional changes in the back to maintain flow and aero balance?
You’ve pointed out the very real box Goodyear is in with how far to take the tire to produce fall off without creating issues? And they can never count on the teams to follow suggestions on pressures in an attempt to gain an advantage and we’ve seen how pushing the pressures can turn out in these low profile tires.
I’m just not sure there is a simple HP/tires solution to it though. Bigger brakes reduced the braking zones and the need to conserve brakes for the end of the race. That eliminated a cause for passing. They aren’t going to rebuild the brake package.
The transaxle allows/requires shifting on short tracks. That changes the dynamics in so many ways. Downshifting is used to help braking which further reduces the braking zone and saves already oversized brakes. If you overdrive or spin tires, just grab a gear-no harm no foul. So the only one that would be positive is when a driver misses one, but can we count on that happening often enough to improve passing? Not with all the sim time these guys get.
But if increase HP, reduce the contact patch, increase fall off, address the brakes and the driver can just grab a gear to overcome them all, what have you gained?
And we haven’t even talked aero. And when aero becomes a major factor on a 1/2 mile bull ring (and it must or why are we running this teenie ispoiler package?) that’s another problem.
As integrated and interdependent everything is on the car, it may take changes to it all
NEXT GEN was sold as a one size races all platform that had the necessary adjustablity in it to put on hood races anywhere.
Maybe. Not showing it now. Maybe all these smart folks can get it there soon.
And what happens if I they do but the on-track product doesn’t noticeably change? Could that point back something like Stage Racing?
Not sure we want to go there…
Lot to think about. Glad it’s not my problem? LOL
I agree with you David, there are no easy fixes. But if I had to choose just 1 area, that I think could make the most difference, I’d choose adding 100+ HP. Unlike the east coast modifieds, I raced what NASCAR calls a Grand American Modified. The front clip then was usually a 68-72 Chevelle or a metric clip. Everything else was all a tubular/boxed steel fab frame. Plus, we raced on 8″ wide slicks (Goodyears unfortunately), where the east coast mods run on 15″ slicks. But just like the east coast mods, we had over 600hp. So no matter what we did with our mods, the tires were the limiting factor. I watched a couple of my competitors drop in excess of $4k for a shock package that the manufacturer swore would knock 2/10ths off their lap times. Both finally admitted that after a season of racing them, they still couldn’t get the car to handle better, or get better lap times. The tires would only take so much, for so long.
I see the same thing for the Cup cars. Shifting or no shifting, big brakes or smaller brakes, the tires still control to all. If you have big brakes, and keep cooking it into the corners, those tires aren’t going to live as long. If you downshift because you over cooked the corner, you’re going to spin those tires, killing them even more. If the extra hp overheats the cockpit, great, create more airflow into the cockpit. That will dirty up the air off the car, making sure that the “dreaded aero push” stays out of the equation. Dirty air and aero balance should not be things that need to be addressed on a short track.
If they don’t want the drivers shifting, that’s an easy fix. NASCAR mandates the gear ratio, they love to mandate things anyway. Another thing that would go hand in hand with Goodyear making a tire with more fall off, have NASCAR limit the amount of tires the teams can have for the weekend. Make it fewer sets then they are currently allowed at every track. They already do that in the truck series. Guess what, now those drivers have to take care of their tires. Did you notice late in the Richmond race, how some teams were in a panic because they used a set of tires at the very first caution, and they were worried about a late caution, because of the allocation? Martin Truex Jr sure noticed, as it cost him the race.
Plus, by having a tire with a lot of fall off, and by limiting the amount of tires a team can have, drivers should be getting what they’ve been asking for for several years now. Put the racing in their hands. Make the cars hard to drive. As you and I have seen first hand, the greatest drivers are the ones that can drive the car well, when things aren’t optimal. Think about every race you ever saw run at Rockingham. Every car had massive tire fall off after just 5 laps (yeah, that track was really abrasive). That didn’t stop the drivers from racing, they just had to be smart, and not destroy their tires in 20 laps. Those races always had comers & goers, and the races were usually good. Tire fall off and tire set limits will keep the haves & the have nots on the same playing field too.
I’m like you, I’m glad I don’t have to decide what gets done. I just see the HP & tires as the easiest way to try and help the short track issues. It would also probably be the least expensive way, and fair to everybody. So because of that, I’m sure that NASCAR won’t view that as viable.
I’m with you Ron on the tires for sure. They are all about strategy these days and zi never understood by they didn’t cut the number of sets of tires back to make teams come up short and have to make some decisions beyond what they do now.
My dad always said if you want to limit the speed do it through the tires. Like your narrow tires you had to run you couldn’t make it all hook up with them so if you had 600 Hp or 1000 Ho did it make a difference? Tires could only transfer so much to the track. I think years ago IMCA went to narrow tires to stop the out of control HP wars. With this car you can’t go narrower but you there are things they can do to get the same effect.
Falloff… I like. Just how much is GY going to deal with which their existing inventory they have to unload. And it’s not like they can unload what they have in another series.
Gears-I’m not sure how much adjustablity those transaxles have and whether the teams can deal with it. At one time I heard they were set and sealed and if you need service or change its 50k a pop. But that was a while back when this first started and not sure of my sources or if once they got into it things changed. If still true that adds up after a while.
Going to be interesting to see how they address it or shorten the runway (sorry-had to throw that in). Listen to what they say and what they don’t say.
Have a good one!
That’s the thing about having tire limits & good fall off. They wouldn’t have to change anything with the transaxle. Keep up/down shifting, and those tires will wear out faster. Heck, my mod engine was not in the top 10 when it came to HP. With that said, I could break the rear tires loose halfway down the straights, and that was on stickers! Which made the last 5-10 laps of a main interesting. The first time I really understood what tire fall off looked like, was for a big race that we had at Tucson Raceway Park. It was also my first extra distance race. This track was converted to asphalt by NASCAR, when they took the lease there from the fairgrounds in 1993. I started my mod career in 98, so not brand new asphalt, but it had really good bite in all 3 grooves. They had an open practice on Friday, before the race on Sat. There was this guy that came in from the LA area, ran regularly at Irwindale. Heck, he was easily a half second a lap faster than any of the TRP regulars. I commented to a friend of mine (the defending mod track champion), “heck we’re all racing for second at best!”. I passed him 7 laps from the end, and it wasn’t much of a battle to do so. I finished 7th. This guy lead the first 30 laps or so. His car was really pushing on entry, and even worse loose on exit when I got to him. Now you need to understand, I was not a really fast racer then, as it was my rookie season, not just in the mod, but in any race car. To say I was surprised that I beat him would be an understatement. So I spent some time discussing it with a great super late model racer. He was the one that got me to understand what a great friend or foe, tire wear could be.
Over the years, on average the longer races were some of my best. I’d love to tell you that it was because I was smarter, but I don’t think that would be accurate. I think it had more to do with my skill set (or lack there of). See I was a total rookie at the young age of 42, in probably the hardest class I could have chosen to race. Trust me when I say, at 42 you do realize that you aren’t invincible or bullet proof!! Plus, I owned all of my equipment, and knew that I would have to foot the bill for being stupid. But even in the shorter races, I usually passed the most cars in the late laps. So actually not being one of the fastest cars in qualifying can have some benefits (not many though).
David, this was an awesome analysis, and it has led to some of the best commentary I’ve seen lately. My bottom line is that NASCAR is going to stick to its attitude of, “You guys all stand down and let us fix things,” and as a result, we’ll either get undeservedly lucky, or nothing will get fixed. I desperately wish our sanctioning body was less controlling and more collaborative. In the meantime, there actually might be a little upward momentum in the sport, and we’re risking losing it. Hey, I was in public relations, marketing, and related communications, and I can spin the facts, but I also know when the opposing spinner has a good case. Too bad that seems to be the way it is now.
NASCAR spun out!
Dave, No Caution!
Thanks Frank. It has been a fun discussion.
I have to agree with your Bottom Line and thought your choice of words was most accurate.
“You guys all stand down and let us fix things” sums it up. I only have to look at the mail slot vent on the front windshield to be reminded how that has gone so far.
It will take collaboration to effect the necessary changes. I’m just not sure with the current business model, plus continuing supply chain issues when changes determined today could actually go into effect and the teams and fans see benefit from them.
Plus for every new part that gets developed and has to be purchased that is another hit to the teams’ budgets. The more changes the longer the runway for teams to eventually realize cost savings… which is what all this was supposed to be about.
Glimmers of positive are still better than things have been in a while. As far as an opposing case, I think it’s a more complete representation. If that plays out favorable-so be it. Same with unfavorable. The funny thing is there is nothing I do that the Sanctioning Body shouldn’t be figuring already.
It’s been an interesting discussion.
Thanks again!
Have a great race day!
Bravo David!!!
No one is better at sifting through NASCAR’s BS to get to the truth than you are. Best NASCAR article I’ve read this year. Thank you.
Thanks Bill! The Talladega numbers are up there. So much so I’m still sifting! There is more to this sport than numbers and they aren’t everything but if you gonna use them…
Thanks again. Have a great race day!
I’ve always said that people who think numbers don’t lie never took a bookkeeping course. A good CPA could have Amazon lose $500,000,000 in a fiscal year. When NA$CAR talks about green flag passes I gag. One stat I’d like to see is how many times a car is passed on the track during one of NA$CAR’s events. There hasn’t been a real “race” for years, when the green flag drops and race plays out. But that is not Brian’s vision.
A lots in the presentation DoninAjax! They do have a Times Passed Stat and a resulting Passing Differential (Green Flag Passes – Green Flag Passed). I’ve not gone there yet because it includes the same issues mentioned on Green Flag Passes-no differentiation between what happened on track and while pitting. Till we get that breakdown it’s hard to get a true picture. Guess we can hope, but until then just take a closer look at what’s presented.
As far as vision, I’m just not sure anymore.
Have a great race day!
I just read an article on Jayski.com. NASCAR, the drivers & Goodyear had a meeting Sat morning @ Talledega. Hamlin said that they’re probably going to start playing with tire compounds for the short & road tracks. I truly think that’s the quickest & cheapest way to help both types of tracks, to get better racing. We’ll see how that goes, and my fingers are crossed.
I hope they come up with a solution. What little ai heard from the NHIS tire tests that didn’t sound as encouraging as I had hoped… but it was worth it to hear C Bell’s “gutless engine” comment.
There’s a better article on motorsport.com, by Jim Utter, that is a little more detailed. Even Sawyer sounded a little excited after that meeting. I really believe adding 100hp & a tire with a lot more fall off should really help the competition. Limit the sets of tires to whatever the current allotment is for said track, and see what happens. It couldn’t get much worse could it? If they can run cars at Talledega, with the nose taped together, they can still run in the lead pack. Aero should never be an issue at a 1/2 mile track.
Agreed. I find it kind of funny all the discussions about how long it would take to boost the HP while getting durability when you have power plants developed for Garage 56. You know they aren’t running “gutless engines” in that race and they are built to do 24 Hours.
Glad Elton is excited. For me, I’m going to have to see it. Found my britches legs wet and been told it’s rain too many times.
Aero shouldn’t matter on a short track but the fact that it does makes me think the car is more aero dependent than we were led to believe. And the fact that the 3 got caught tricking up the underside is a further indication.
Not sure how much more adjustments are out there. To hear the guys on Door Bumper Clear even with the reductions those cars were still planted.
Aero shouldn’t make a difference. Shifting needs to be eliminated as well. Need none of that on short track but we got it and doesn’t look like that’s going away.
Got a lot of smart people working on it, so hopefully a solution will be arrived at soon. Now that fans have woke up to what kind of on track product they have for short tracks, things could get ugly quick.
Good news is Chase is back.
Something that I’ve wondered about with this new car. What happens if the entire belly pan is removed. The whole reason for a belly pan is to create downforce. Just ask Smokey, as that’s what he did to that Chevelle in the late 60s. That would truly dirty up the air, and that should help eliminate some of the aero issues. It’s held on with fasteners I think, so shouldn’t be hard to test. Add that to that 2″ spoiler & 100hp, that should make the car a handful I would think. David, I’m really glad you brought up the belly pan, as my brain apparently had forgotten about it. I don’t have a clue if they would need to remove every section of it (I think there is 3 sections). So maybe one section or another, might be more critical for keeping the front/rear balance. But it shouldn’t be that hard to track test that, and you wouldn’t need the entire garage to be at that test. Just a handful of cars should do it. On a short track, the draft wake shouldn’t be too great. Heck just remove the whole thing for a short track or two, and you’d have the answer on if it would give the desired effect. I had a much smarter sports car racer & engineer, try to explain how a belly pan affects a car at speed. When my eyes started glazing over, he stopped and said “Think of it as a giant vacuum cleaner inside the car, and it’s trying to suck the asphalt into the car.” Ok, I can understand that. Hell, we’ve spent the last 40+ years learning how to make a race car more aerodynamic, it shouldn’t be that hard to dirty it up. Again, it comes back to NASCAR’s ego, and admit that this new car needs some help, and that they don’t know what to do. Do you think that will ever happen?? Me either.
Interesting thought. I’m not sure just how that would work when you consider how interrelated stuff is and what would get exposed and be subject to possible pre-NEXT GEN tweaking to gain an advantage. If you remove that does it expose the exhaust to more rubber buildup? What’s the impact on cockpit heat and fumes? Part of the whole underbody/diffuser concept was to pass the air back to the trailing car so as to minimize aero push. What’s it do to that. is the trade off of more difficult driving due to reduced downforce equal to the aero push on the trailing car?
It might be an answer, I dunno. Be interesting to see if they have any sim for it.
One concern I have is the more they mess with it the further they get away from what makes the car what it is and at some point it gets tweaked into an admission that this design isn’t working.
That’s a pill no one is willing to swallow.
Will be interesting to see how they solve this one.